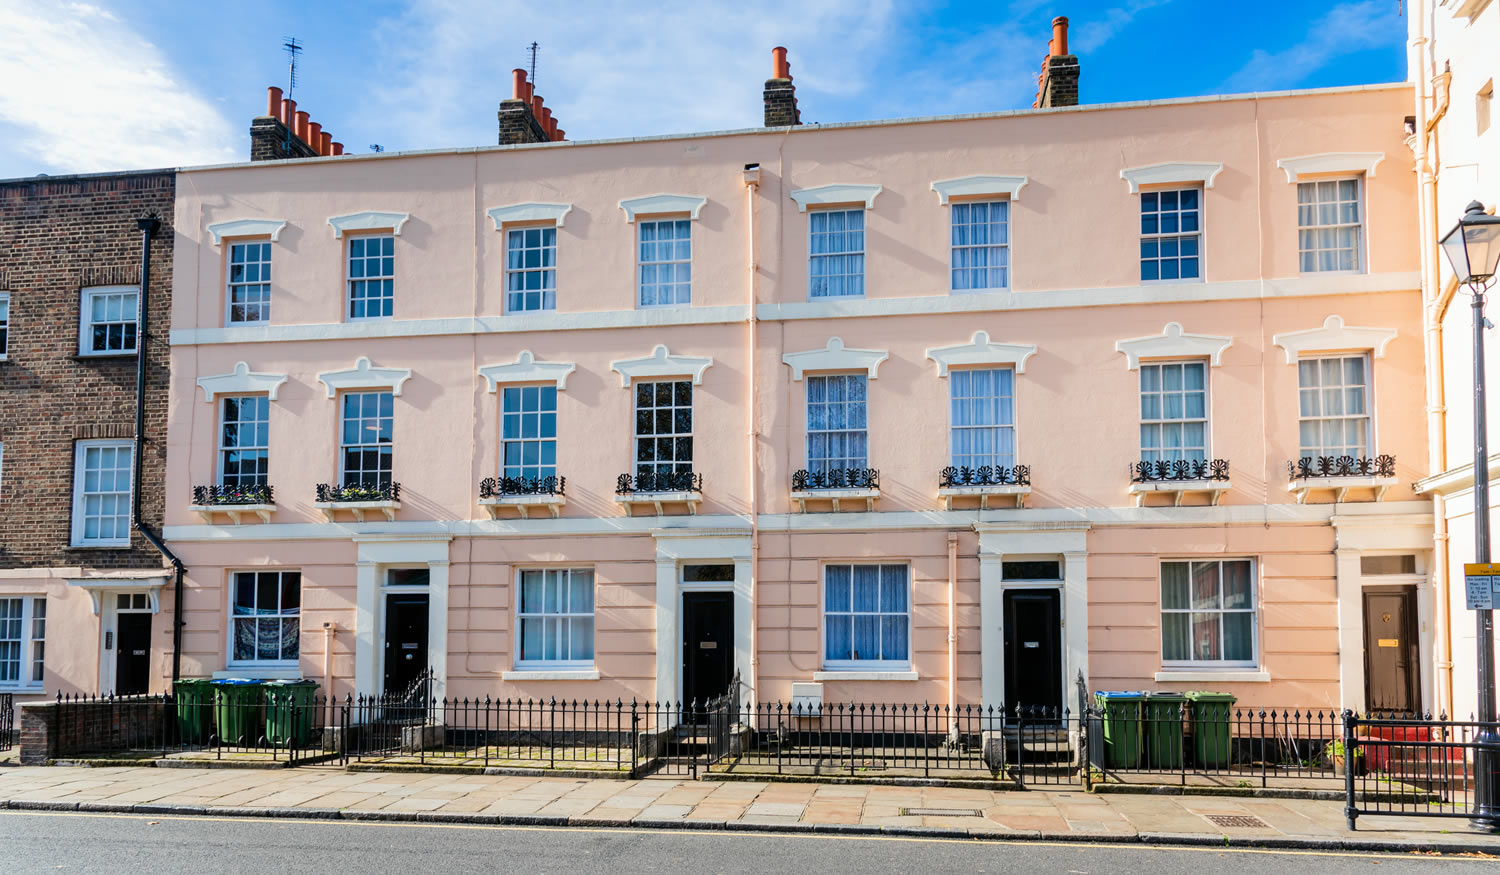
Over the last decade house prices in the UK twenty cities have increased by 54% with London leading up 74% since 2009.
The latest data from Zoopla’s Cities House Price Index reveals over the last decade growth in property value of the top twenty cities is up 54% across the UK averaging 4.4% per year.
London is leading the rise in house prices up 74% since 2009 with an average annual rise of 5.7% followed by Cambridge and Bristol both with 5.3% per year.
Homeowners have benefitted from this growth with remortgage buyers in a position to release capital which they can use to improve their home such as adding an extension or new kitchen.
Marked slowdown in southern England
A number of cities in the south of England with strong growth over the past ten years have experienced much slower growth in the last three years including London, Cambridge, Bristol, Oxford, Portsmouth and Southampton.
The following table from Zoopla shows the compound annual growth rate (CAGR) and current house prices to November 2019.
| City | Current price | 10-year CAGR |
|---|---|---|
| London | £479,000 | 5.7% |
| Cambridge | £417,000 | 5.3% |
| Bristol | £285,600 | 5.3% |
| Oxford | £411,500 | 4.6% |
| Leicester | £180,200 | 4.0% |
| Portsmouth | £239,700 | 3.9% |
| Manchester | £173,400 | 3.7% |
| Birmingham | £167,700 | 3.7% |
| Nottingham | £169,700 | 3.7% |
| Bournemouth | £291,100 | 3.7% |
| Southampton | £228,000 | 3.6% |
| Cardiff | £211,100 | 3.3% |
| Edinburgh | £240,500 | 3.0% |
| Leeds | £168,600 | 2.8% |
| Sheffield | £139,400 | 2.4% |
| Liverpool | £121,900 | 1.6% |
| Newcastle | £129,700 | 1.5% |
| Glasgow | £123,600 | 1.4% |
| Aberdeen | £159,000 | -0.1% |
| Belfast | £138,000 | -0.3% |
The growth rate for the top 20 cities over ten years has averaged 4.4% per year with an average property value of £257,200 and other cities with slow growth in the last decade have above average growth recently including Glasgow, Liverpool and Belfast.
Rising house prices has allowed the equity release buyer to access money with a lifetime mortgage and use this to repay an interest only mortgage or buy a more expensive home.
Higher property values means first time buyers may need to continue renting or consider the Help to Buy scheme or Shared Ownership to get on the property ladder.
Over twenty years there have been some notable peaks in 2002 with prices up an average 24.4% for this year and only fall in 2008 of -12.5%.
Affordability factor the key driver
Analysis by Zoopla shows the rise of house prices since 2009 has been drive by lower mortgage rates and higher household incomes.
Looking forward this is changing to housing affordability and recent falls in property values in London has improved affordability by 10% since 2017.
Price to earnings ratio of the capital reached a high of 14x in 2017 and this has reduced to 12.7x last seen in 2015 although remains much higher than 20 years ago.
For home movers affordability can be an issue when trading up as their next property is usually more expensive which means they need a larger deposit or mortgage.
In contrast buy-to-let investors purchasing in the capital where house prices are higher would need a larger deposit to reduce the mortgage or higher rental income to cover the interest payments.
House price growth in London is only a third of the 10-year growth rate and Zoopla expects prices to rise by 2% in 2020 whereas other cities will average 3% and affordable regional cities could rise by 4%.
What are your next steps?
Call our LCM mortgage brokers if you are a buy-to-let landlord with a property, remortgaging and want the best mortgage deal, buying your first home or you are planning to move home.
Learn more by using the mortgage monthly cost calculators, property value tracker chart and equity release calculator. Start with a free mortgage quote or call us and we can take your details.
For equity release buyers our London City Mortgage advisers can recommend lifetime mortgages allowing you to receive cash from your home to spend on anything or even benefit a family member.

