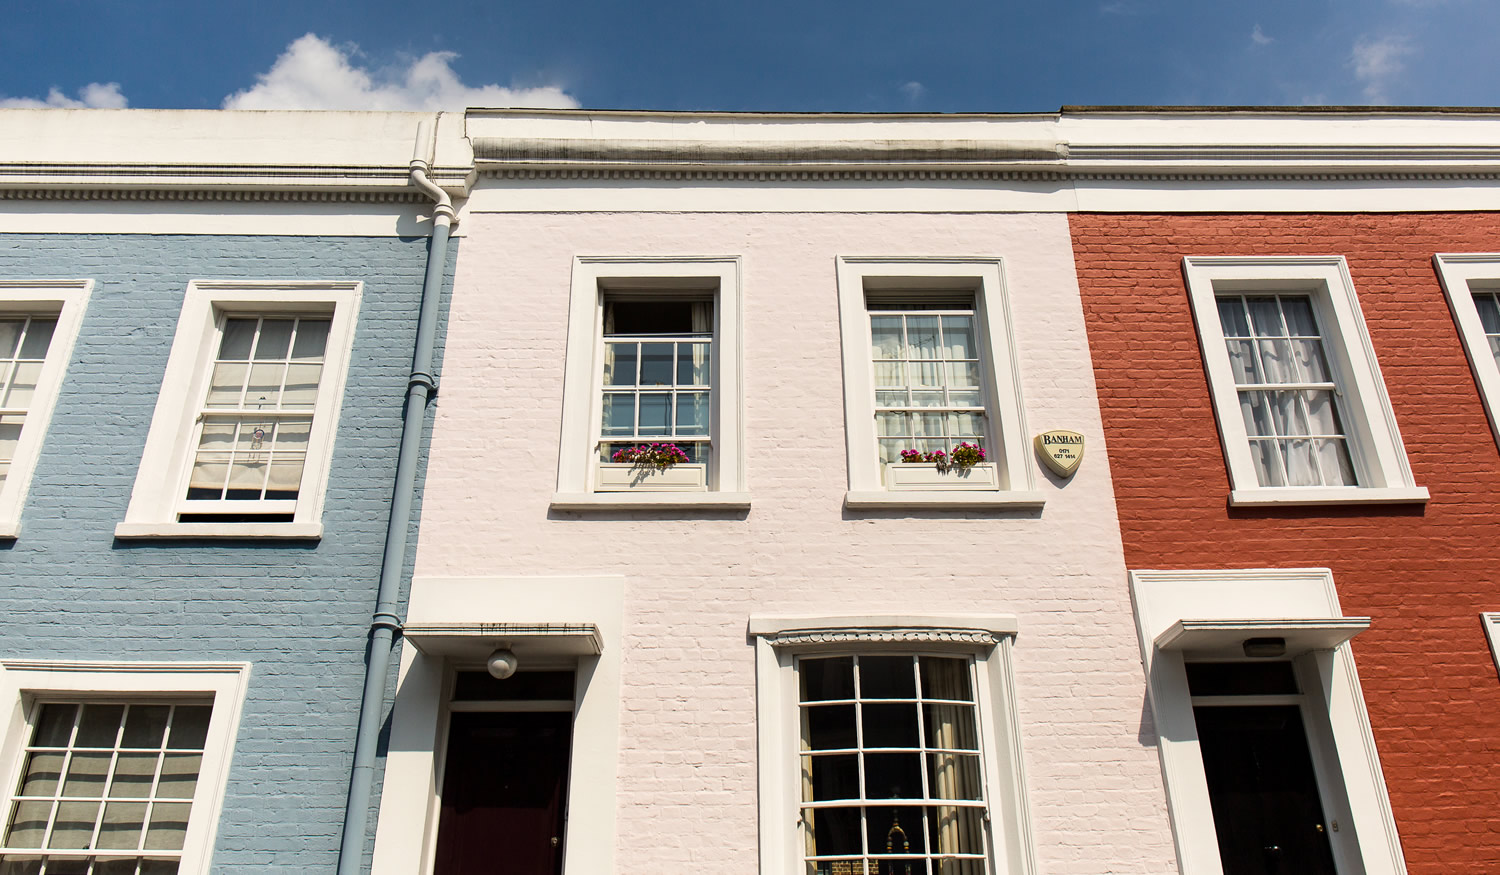
House prices coming to the market in London have reduced by more than £13,000 this month helping to move property more quickly.
Research from Rightmove shows London house prices are lower by -2.2% or down -£13,353 to an average of £603,855 this month and the first fall at this time of year since September 2010.
The reduction in London property values is good news for first time buyers as they would require a lower deposit or smaller mortgage to get on the property ladder.
The lack of suitable properties could mean it is easier for remortgage buyers to stay in your existing home if you can and avoid the cost of moving.
Lower prices are helping to reduce the time taken to secure a buyer for properties reducing from 72 days at this time last year to 69 days this month, a fall which has not occurred since June 2016.
Highest price properties bucking the trend
It is still difficult to secure a buyer for the most expensive properties as they buck the improving tend with the time taken increasing from 87 to 90 days.
Miles Shipside Rightmove director said, there are over 20% fewer properties coming to market in all market sectors compared to a year ago, including the “top of the ladder” sector where numbers were already relatively low.
Owners seem to be holding back awaiting either a more certain Brexit outcome or a market recovery and perhaps both.
The following table from Rightmove shows average house prices and annual change for London homeowners to September 2019.
| Borough | House prices | Annual change |
|---|---|---|
| Southwark | £654,779 | 3.9% |
| Newham | £418,290 | 2.1% |
| Hammersmith and Fulham | £896,356 | 1.8% |
| Kensington and Chelsea | £1,605,483 | 1.1% |
| Bromley | £535,404 | 1.0% |
| Greenwich | £447,785 | 0.9% |
| Waltham Forest | £491,935 | 0.7% |
| Hackney | £652,833 | 0.6% |
| Lewisham | £465,459 | 0.4% |
| Havering | £408,335 | 0.0% |
| Ealing | £548,162 | 0.0% |
Leading the rise in house prices is Southwark with prices rising 3.9% over the year with average property values of £654,779 and Newham up 2.1% annually and values of £418,290.
Higher property values for older homeowners allows the equity release mortgage buyer to access wealth and improve your quality of life or help your children start or expand a business.
For home movers wanting to trade up when prices are falling, they may find the gap to their next property decreases which means they need a smaller deposit or mortgage.
Brexit deadline adds to uncertainty
Although the London market is bottoming out there remains uncertainty since the referendum over three years ago with the looming Brexit deadline approaching.
Asking prices for the top end properties have decreased by -2.6% year-on-year compared to London as a whole lower by -2.1%.
For London transport only Zone 6 has seen rising prices over the month up 1.9% and over the year higher by 0.4% with average property values of £489,354.
The biggest decrease is for Zone 4 lower by -3.2% over the year with average prices of £470,997 followed by Zone 2 down -3.0% with prices of £714,356.
With higher house prices in the capital buy-to-let landlords may look to outer London for affordable properties to help improve rental yields such as Enfield where prices are lower by -2.4% and average prices of £453,251.
What are your next steps?
Speak to our LCM mortgage advisers if you are planning to move home, buying your first home, remortgaging your existing home to a new cost effective mortgage deal or are a buy-to-let investor.
Learn more by using the mortgage cost calculators, equity release calculator and property value tracker chart. Start with a free mortgage quote or call us and we can take your details.
For equity release buyers our London City Mortgage brokers can recommend lifetime mortgages allowing you to receive cash from your property to help maintain your standard of living as costs rise.

